CAPITAL & RISK MANAGEMENT
As at 31 March 2015, A-REIT’s balance sheet remained strong with its aggregate leverage at 33.5%. With a debt headroom of
around S$1.7 billion before aggregate leverage reaches 45%, A-REIT is well-positioned to seize investment opportunities when
they arise.
In March 2013, the Manager raised S$406.4 million through a private placement to fund its investments. The proceeds had since
been fully deployed for the acquisition of The Galen in March 2013 and to part-fund the acquisition of Aperia and its related
transaction costs in August 2014.
A-REIT’s weighted average term of debt is 3.6 years as at 31 March 2015 with a weighted average all-in borrowing cost of 2.7%
per annum. Interest rate swaps are used to manage or hedge the interest rate exposure of its debts. About 68.2% of A-REIT’s
borrowing is hedged with a weighted average term of 3.7 years.
In FY14/15, A-REIT fully redeemed its
€
197.5 million (S$395 million equivalent) Commercial Mortgage Backed Securities (“CMBS”)
issued in 2007 via debt issues and bank debt. The proportion of unencumbered investment properties increased to 86.1% as at
31 March 2015 from 62.2% one year ago.
During the year, the Manager issued about S$298 million worth of Notes (comprising of HKD620 million 3.5-year Notes, S$95
million 5-year Notes, and HKD640 million 15-year Notes) under its Medium Term Note Programme. The Manager also secured
two S$100 million 5–year Term Loan Facilities. All the notes and loans were competitively priced and they further diversified
A-REIT’s source of funds. The funds were used to refinance short-term borrowings and the CMBS, and to partially or fully fund the
acquisitions of Hyflux Innovation Centre, Aperia and The Kendall.
As at 31 March 2015, none of the investors of the S$300 million Exchangeable Collateralised Securities (“ECS”) exercised their
option to convert their ECS holdings into A-REIT units. The ECS will mature on 1 February 2017.
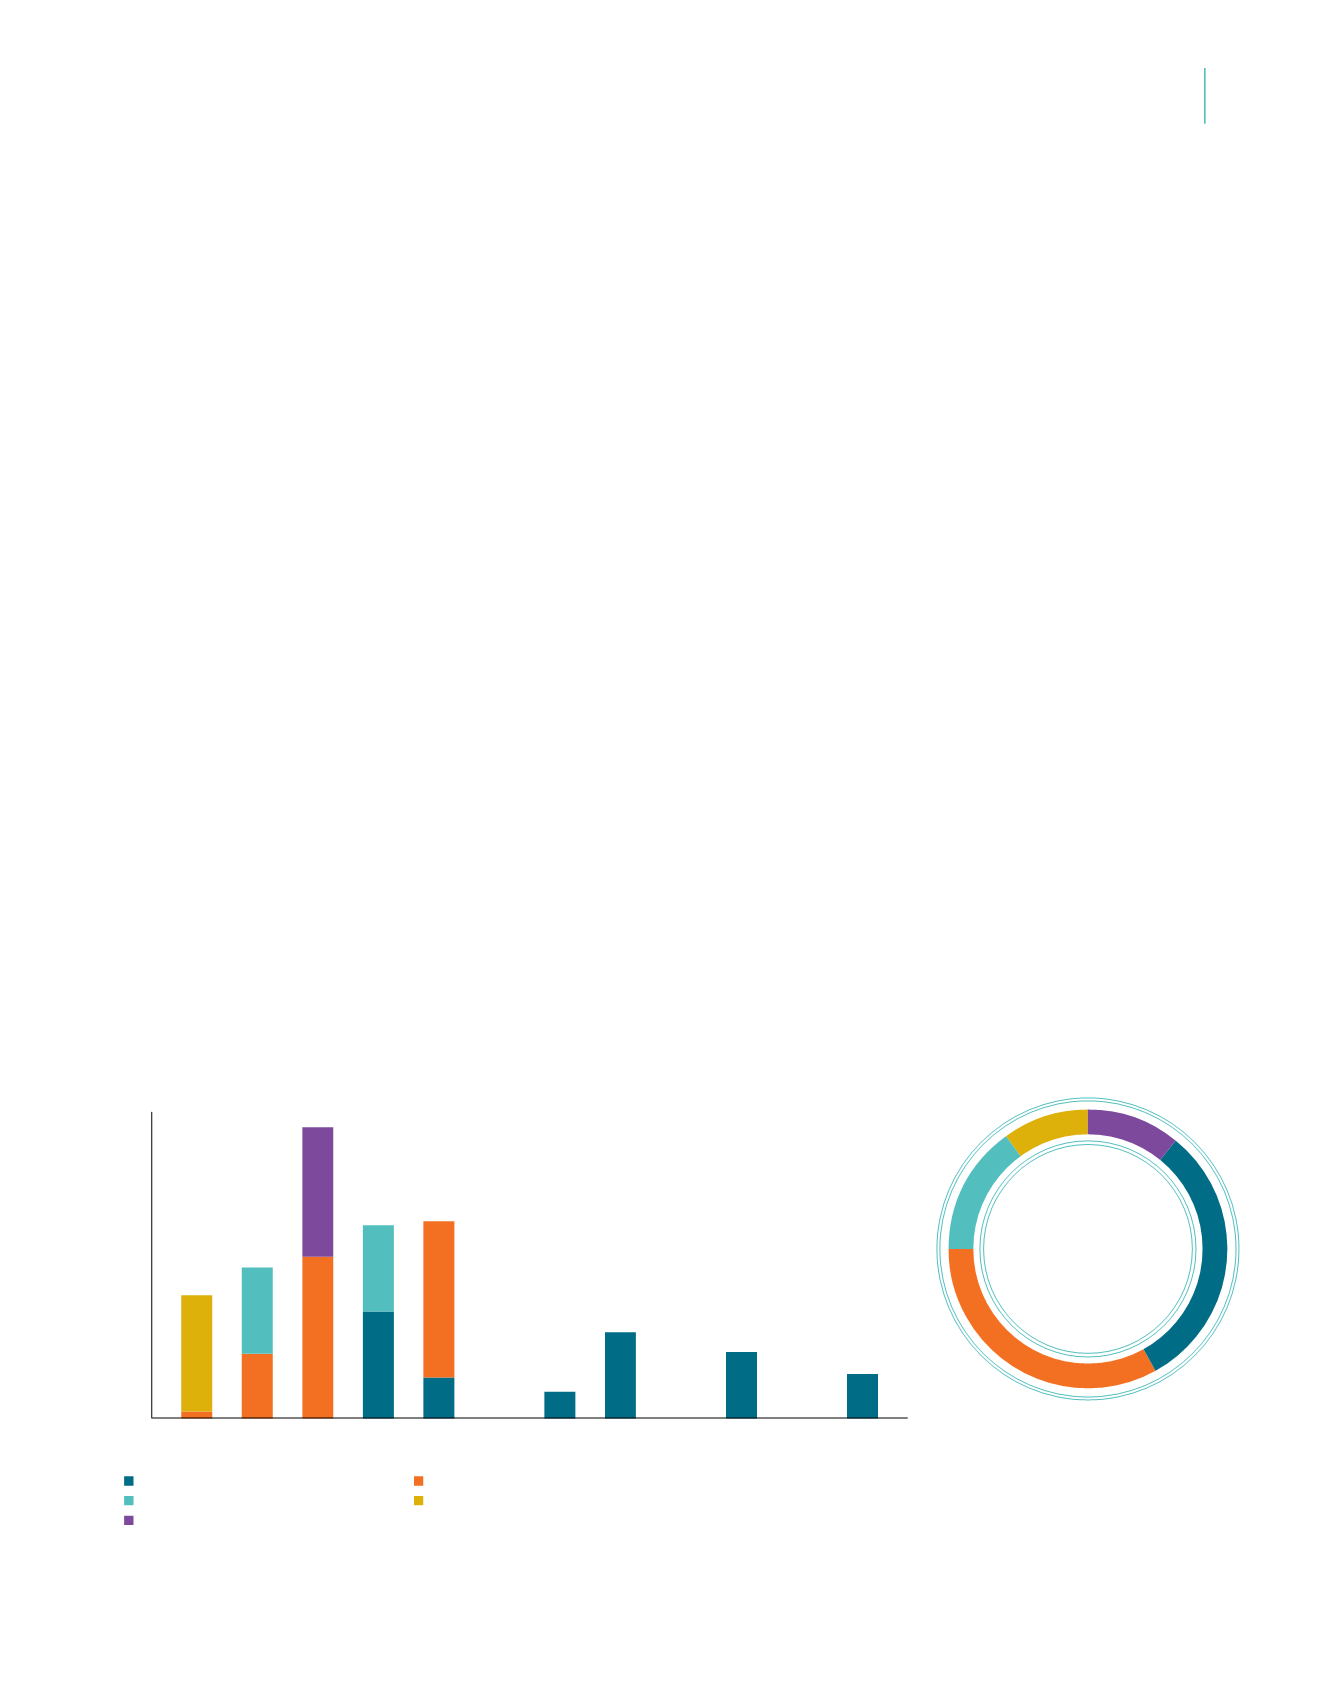
To minimise refinancing risk, the Manager intends to continue to keep a well-spread debt maturity profile.
Debt Maturity Profile and Sources of Debt (as at 31 March 2015)
S$’m
700
600
500
0
300
100
400
200
2015
2019
2017
2021
2023
2016
2020
2018
2022
2024
//
2029
270
150
200
375
248
362
95
62
200
154
103
11%
33%
15%
10%
31%
200
300
16
Medium Term Notes
Committed Revolving Credit Facilities
Exchangeable Collateralised Securities (ECS)
Term Loan Facilities
Revolving Credit Facilities
36 37


