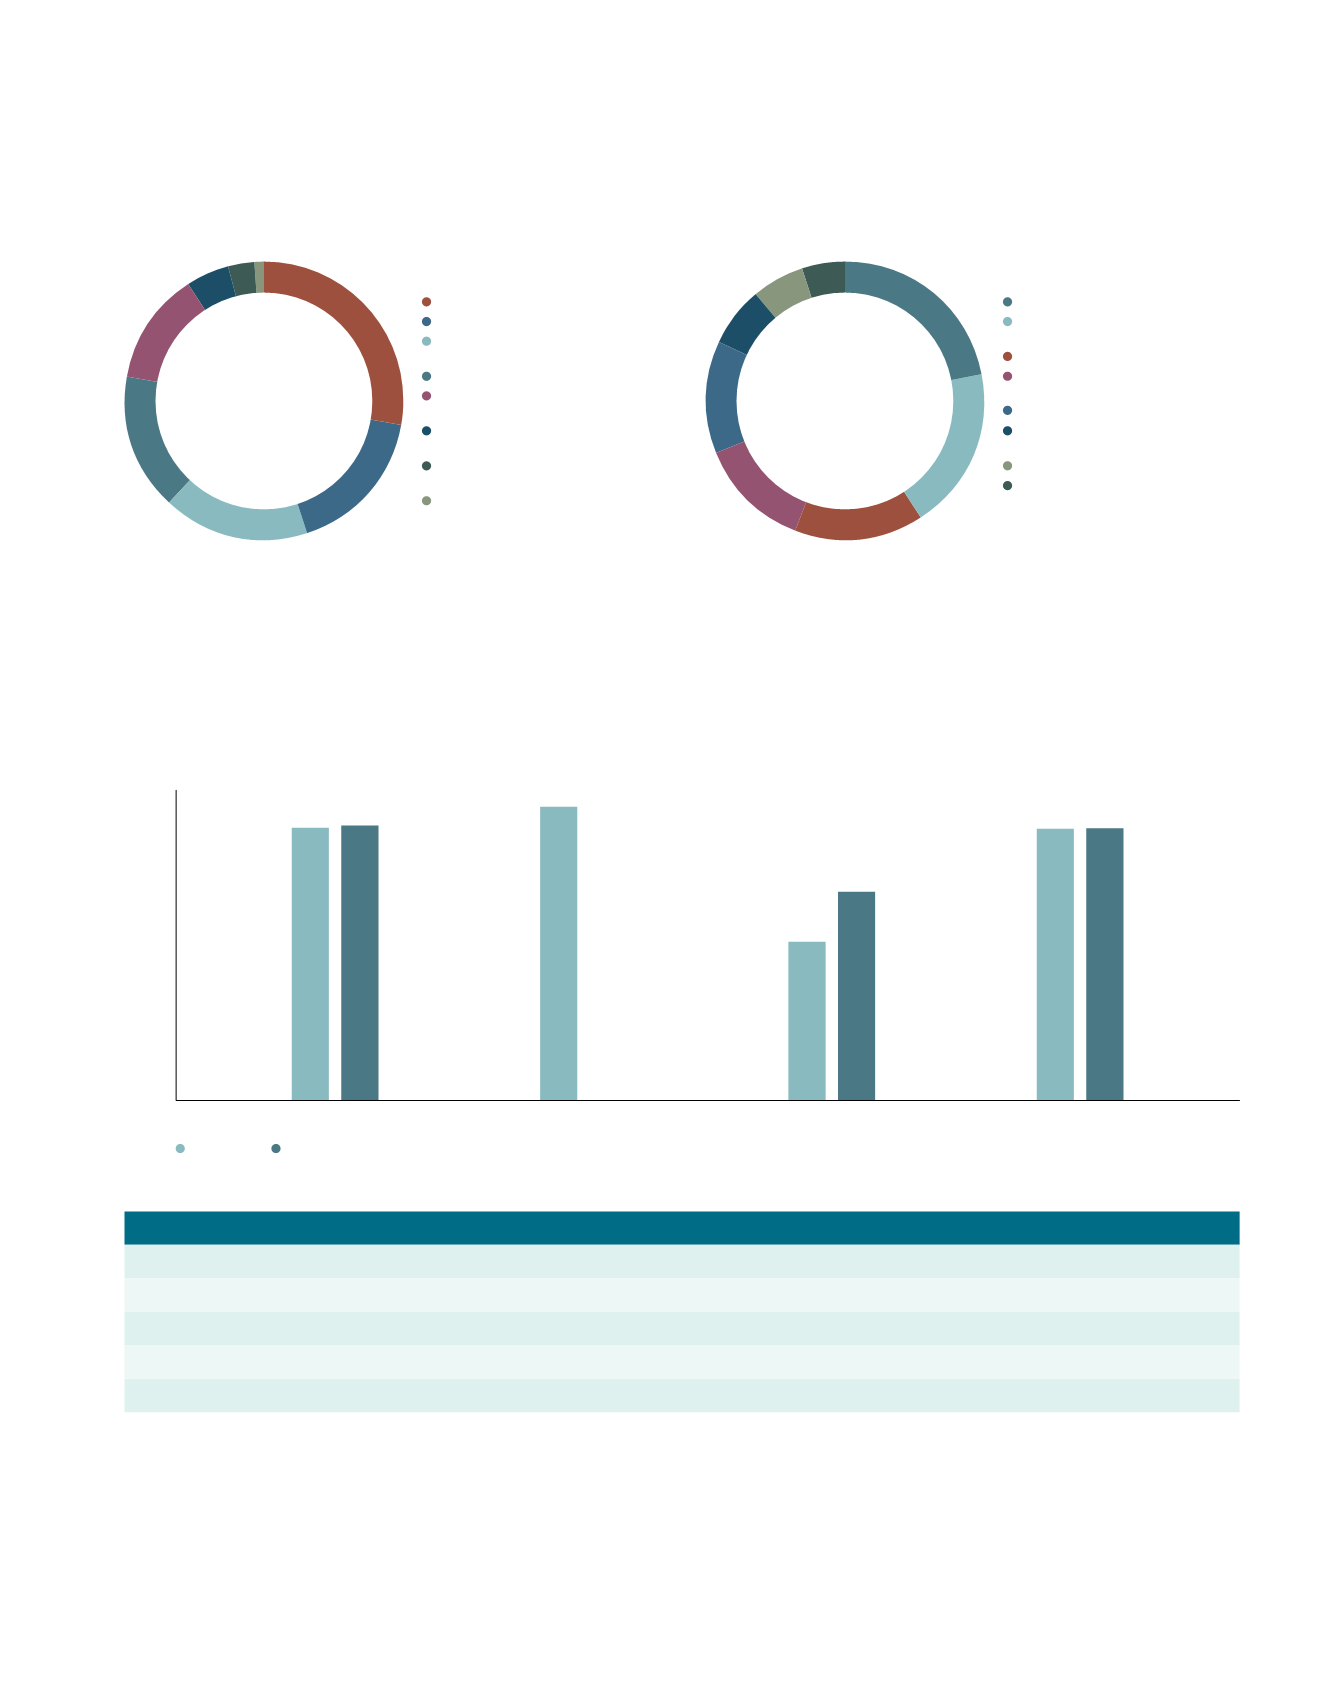
Breakdown of Expiring Leases for FY16/17 and FY17/18 by Gross Rental Income (as at 31 March 2016)
OCCUPANCY
As at 31 March 2016, the occupancy rate for A-REIT’s overall portfolio stood at 87.6% (from 87.7% as at 31 March 2015).
With proactive marketing and leasing of space in properties such as Aperia, occupancy rate of the Singapore portfolio stands
at 87.9% (from 88.6% as at 31 March 2015). On a same-store basis, multi-tenant occupancy declined from 86.5% to 85.4%.
Overview of Portfolio Occupancy
Singapore Portfolio Occupancy
As at
31 Mar 2016
31 March 2015 Percentage Change
Total Singapore portfolio GFA (sqm)
2,967,777
(1)(2)
2,904,336
(1)
2.2%
Singapore portfolio occupancy (same-store)
(3)
88.9%
90.8%
-1.9%
Singapore MTB occupancy (same-store)
(3)
85.4%
86.5%
-1.1%
Overall Singapore portfolio occupancy
87.9%
88.6%
-0.7%
Singapore MTB occupancy
83.2%
84.0%
-0.8%
(1) Excludes 2 Senoko South Road which has been decommissioned for asset enhancement works.
(2) Excludes 26 Senoko Way and BBR Building which was divested in April and September 2015 respectively.
(3) Same-store occupancy rates for 31 March 2016 and 31 March 2015 are computed with the same list of properties as at 31 March 2016, excluding new
investment completed in the last 12 months, divestments and changes in classification of buildings from single-tenant buildings to multi-tenant buildings.
The Australia portfolio is 94.7% occupied whilst the China portfolio is 51.2% occupied. We will continue to exploit our leasing
capabilities to improve occupancy within the portfolio to achieve organic growth for the portfolio.
Business park
Light Industrial
Logistics & Distribution
Centres (Singapore)
Science Park
High-Specifications
Industrial
Integrated Development,
Amenities & Retail
Logistics & Distribution
Centres (Australia)
Business Park (China)
28%
17%
17%
16%
13%
5%
3%
1%
Science Park
Logistics & Distribution
Centres (Singapore)
Business park
High-Specifications
Industrial
Light Industrial
Integrated Development,
Amenities & Retail
Business Park (China)
Logistics & Distribution
Centres (Australia)
22%
19%
15%
13%
13%
7%
6%
5%
Singapore
Australia
China
Total
100%
0%
40%
20%
60%
10%
50%
30%
70%
80%
90%
87.9% 88.6%
94.7%
51.2%
67.3%
87.6% 87.7%
N.A.
Mar-16
Mar-15
FY16/17
FY17/18
.43
A-REIT ANNUAL REPORT
2015/2016


