INDEPENDENT MARKET STUDY
S Y D N E Y
Sydney industrial market
The Sydney industrial market fundamentals are among the
best of all industrial markets at present. Sydney is benefiting
from urban renewal and infrastructure development projects
being coordinated by the government to increase the
population density of inner ring suburbs and the efficiency
of the Sydney transport and freight network. As such, many
mature industrial markets are being rezoned to allow for
mixed use or residential projects.
This activity is creating a cascade of occupier activity that
will impact the market for some time, creating immediate
demand for existing stock, decreasing vacancy and placing
upward pressure on market rents. This will also result in
demand for larger distribution facilities in the Western
Sydney growth precincts as existing market rents increase
and larger users look to grow into more modern facilities.
Supply
Around 342,300 sqm of new supply was completed across
Sydney in 2015, significantly below the 10 year annual
average of 557,000 sqm. Only approximately 9% of new
supply (by area) in 2015 was completed without known
tenant commitments.
The forward pipeline indicates that supply will increase over
the next 12 months. There is currently 255,200 sqm of new
supply under construction and another 301,500 sqm at
the planning stages for 2016 (Figure 3). More than 68% of
this supply has a known tenant commitment. Based on the
current projects in the 2016 supply pipeline, the average
development size is expected to increase to 19,200 sqm,
above the 5 year average of 16,300 sqm.
Figure 3: Sydney industrial supply pipeline
Demand
Occupier demand improved significantly in 2015 with gross
take-up reaching 859,500 sqm, well above the 10 year annual
average of 607,000 sqm (Figure 4). Major storm cell activity in
May 2015 damaged multiple Outer Central West buildings,
resulting in more than 125,000 sqm of occupier relocations.
Vacancy tightened significantly in western Sydney as a result.
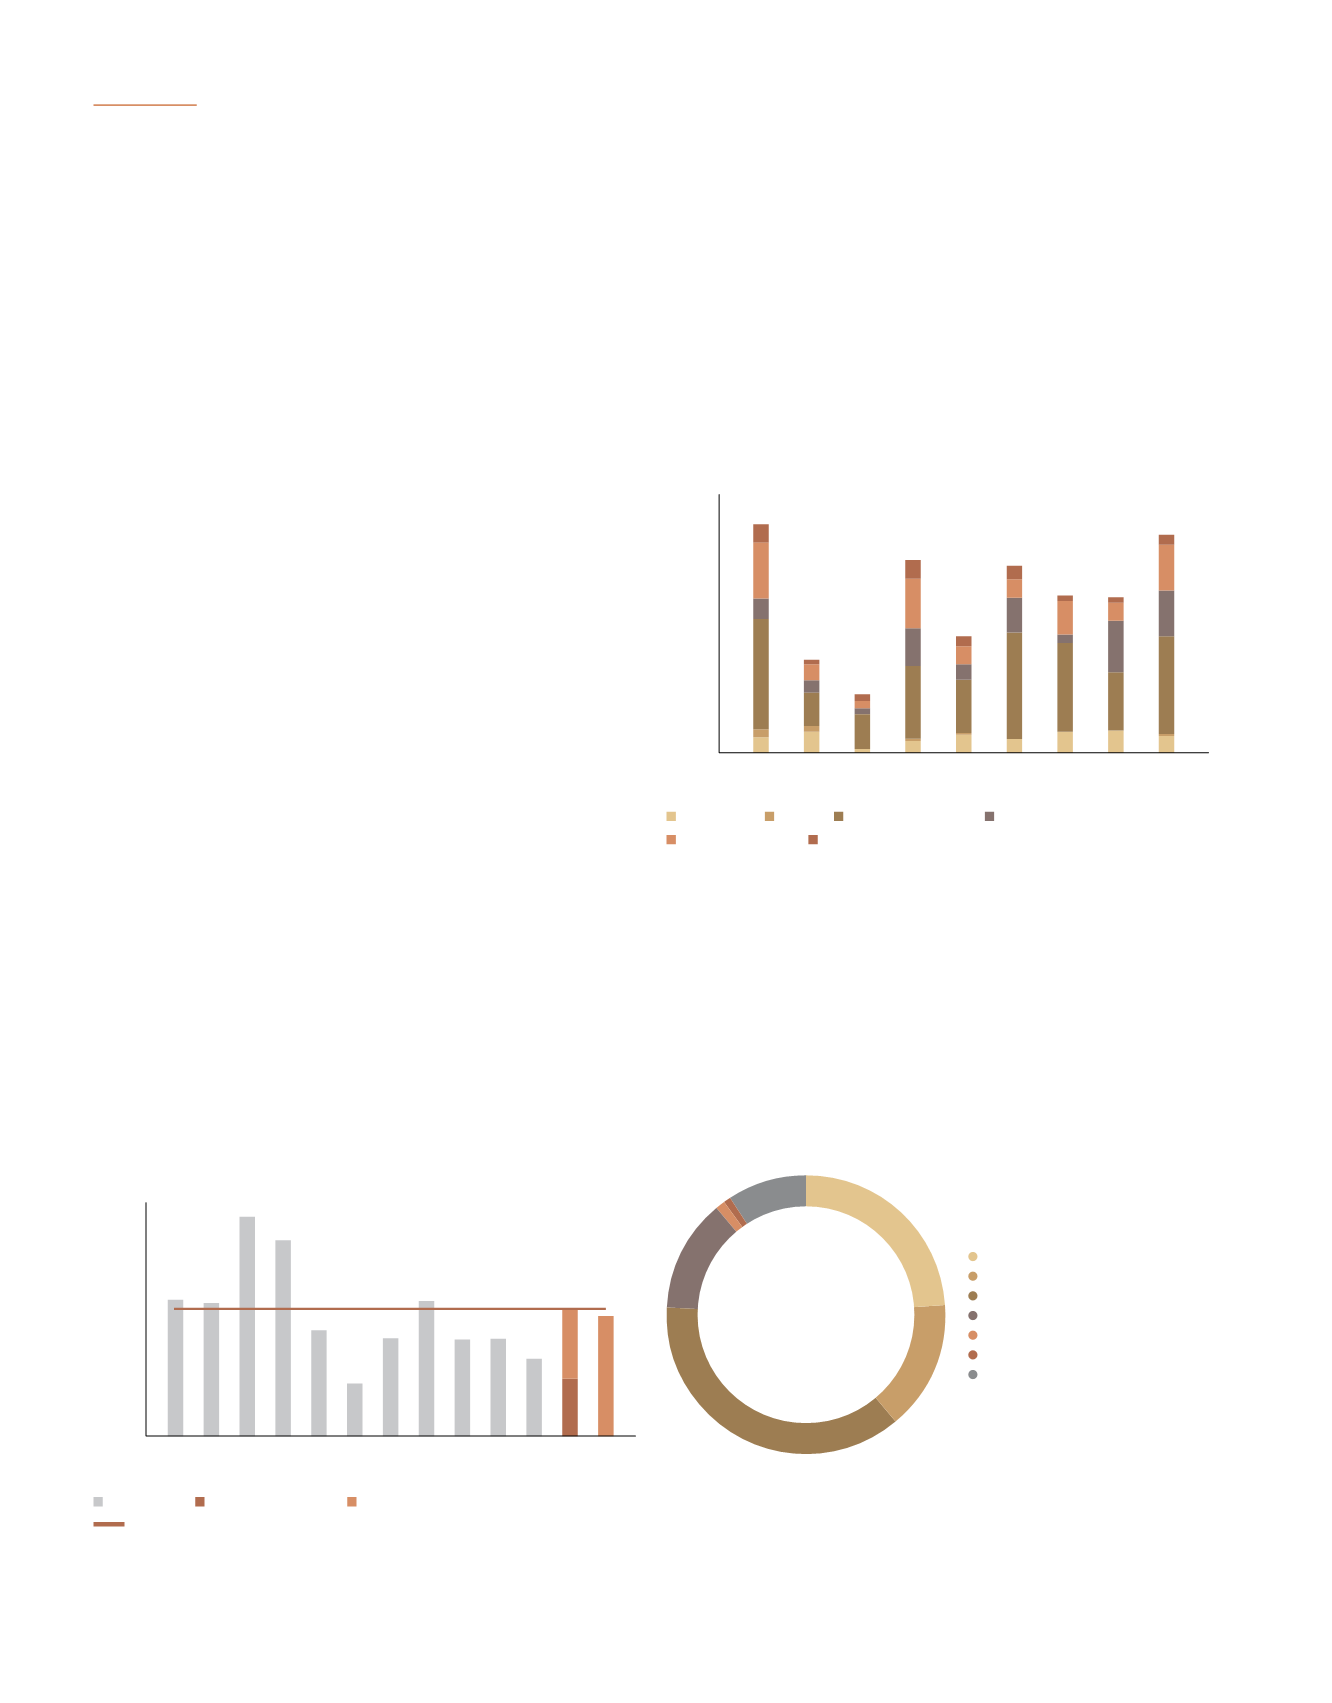
Figure 4: Sydney industrial occupier gross take-up by precinct
The outer western precincts of Sydney have captured the
majority of occupier take-up since 2007, with the Outer Central
West accounting for 47% of gross take-up since 2007, much
of which has been developed in this period. The Outer South
West has accounted for 19% of take-up, while the Outer North
West has accounted for 16% of take-up since 2007.
Figure 5: Sydney gross take-up by industry sector:
2013 to 2015
* As at Q4/2015
Source: JLL Research
0
200
500
800
300
600
900
1,000
SQM (‘000s)
100
400
700
Completed Under Construction Plans approved/submitted
10 year annual
2008
2005
2006
2010
2012
2009
2007
2011
2013
2015
2016*
2017*
2014
10 year annual average
Source: JLL Research
* As at Q4/2015
0
600
700
800
1,000
900
SQM (‘000s)
500
400
300
200
100
2008
2010
2012
2009
2007
2011
2013
2015*
2014
Inner West
Outer South West
South Sydney
North Outer Central West
Outer North West
* As at Q4/2015
Source: JLL Research
Manufacturing
Retail Trade
Transport and Storage
Wholesale Trade
Construction
Mining
Other
24%
15%
37%
13%
1%
1%
9%
.84
A-REIT ANNUAL REPORT
2015/2016


