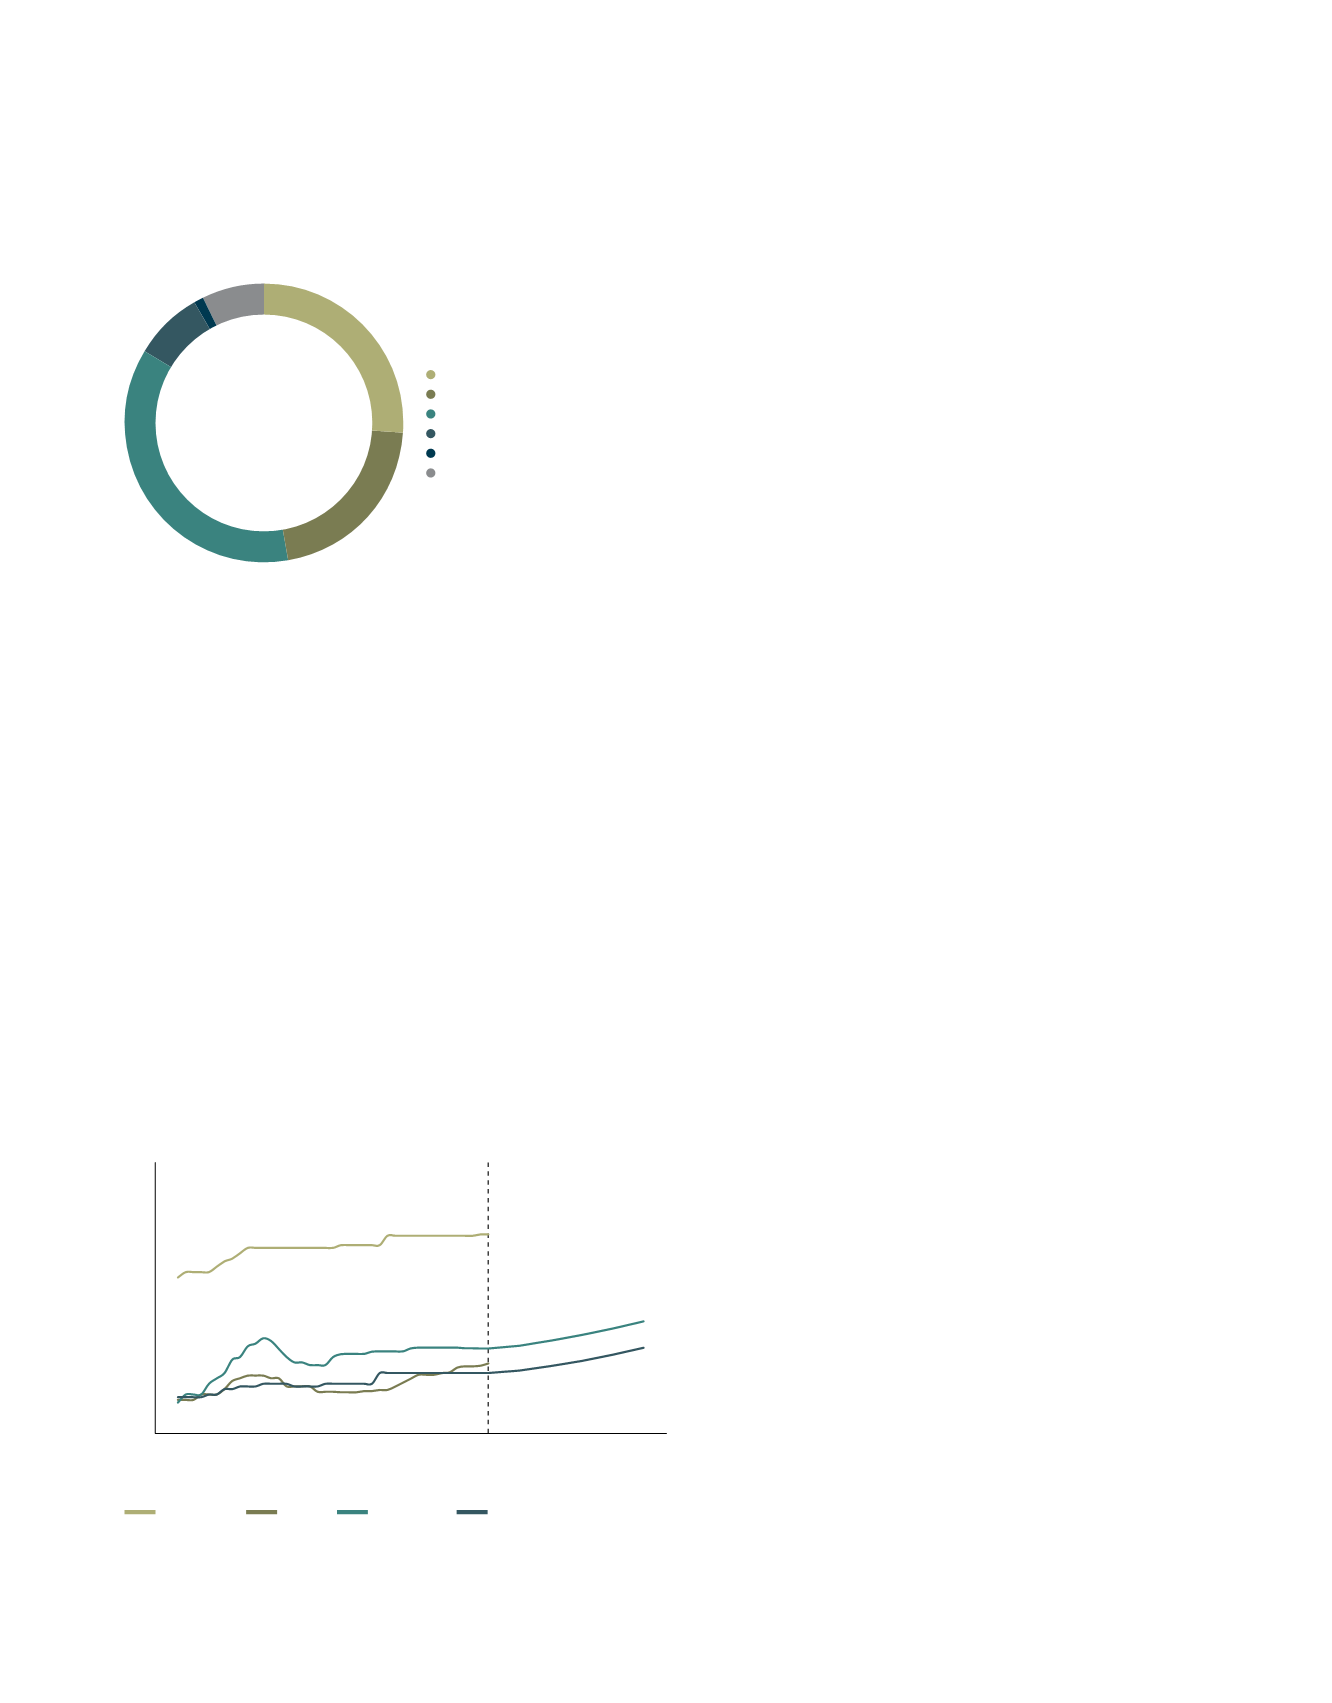
Figure 9: Melbourne gross take-up by industry sector:
2013 to 2015
Rents
In the 10 years to December 2015, prime net rents increased
by 1.3% p.a. in the West, 2.9% p.a. in the South East, 2.0%
p.a. in the North and 1.4% p.a. in the City Fringe precinct
of Melbourne in the 10 years to December 2015. Given the
lower land supply in the South East, occupier fundamentals
are more positive and rental growth has been stronger in this
sub-precinct.
As evident in Figure 10, rental growth has been more subdued
in the most recent five years, attributable to a competitive
development environment and a higher rate of speculative
development activity in Melbourne. For example, prime
rental growth was 0.8% p.a. in the South East and 1.1% p.a.
in the West in the five years to December 2015.
Figure 10: Melbourne prime grade net rents
Over the five years to 2020, rental growth is expected to
average 2.3% p.a. in the South East precinct and 2.4% p.a.
in the West.
Outlook – Fundamentals
Indications are that tenant demand continues to improve
and that known tenant briefs in the market will see further
solid take-up outcomes in the near term. Occupier activity is
expected to continue to be driven by the new build market
through pre lease and Design & Construct transactions, with
significant zoned land competing for tenants.
There is expected to be some ongoing shift from the South
East to the West precinct where tenants are not required to
be in the South East, as well as some shuffling of location
by car component and aftermarket manufacturers when
domestic vehicle manufacturing plants cease operating in
the next two years.
Retailers and 3PL operators are expected to drive demand,
while some manufacturing users may relocate from
manufacturing space to distribution focused space. New
supply is likely to remain broadly steady in the short term and
be driven by tenant demand rather than speculative activity.
Outlook – Investment
Strong investment volumes are expected to continue into
2016 as the strong level of supply added to the market over
the past 18 months provides opportunities for investors
looking for prime grade, large format assets with strong
lease covenants as some owners (particularly developers)
look to decrease allocations to Melbourne.
* As at Q4/2015
Source: JLL Research
Manufacturing
Retail Trade
Transport and Storage
Wholesale Trade
Construction
Other
26%
21%
36%
8%
1%
7%
Source: JLL Research
* As at Q4/2015
50
75
100
125
150
Prime grade existing
net face rents $/sqm p.a.
Dec-05
Dec-10
Dec-14
Dec-08
Dec-12
Dec-16
Dec-19
Dec-07
Dec-11
Dec-15
Dec-18
Dec-09
Dec-13
Dec-17
Dec-20
City Fringe
North
South East
West
Forecast
Dec-06
.87
A-REIT ANNUAL REPORT
2015/2016


