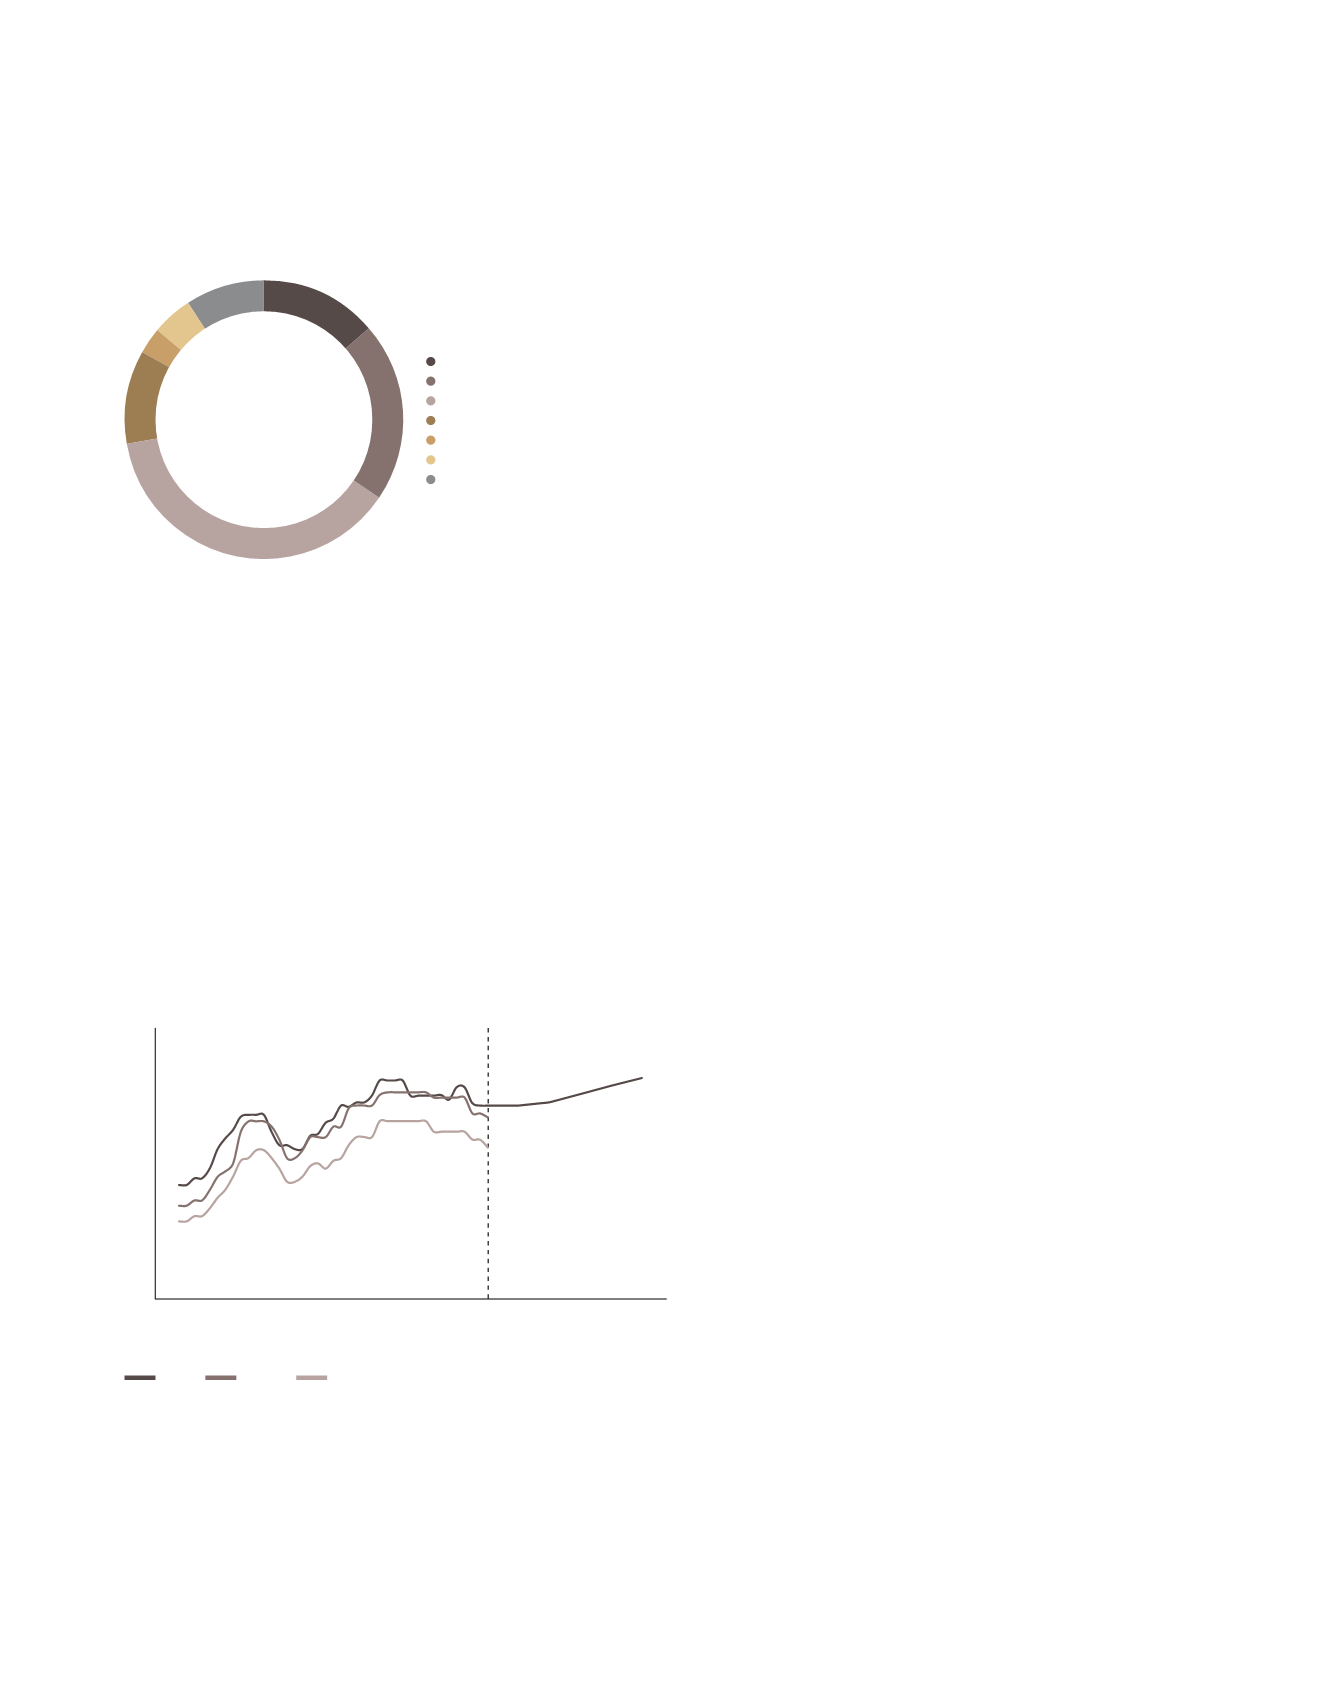
Figure 17: Perth gross take-up by industry sector:
2013 to 2015
The transport and storage sector has accounted for 38%
of gross take-up in Perth between 2013 and 2015. This is
consistent with other markets. Similarly, retail trade (21%),
manufacturing (14%) and wholesale trade (11%) are the
major users in the Perth market (Figure 17).
Rents
As Figure 18 shows, prime net rents have increased by 2.8%
p.a. in the East precinct, 3.1% p.a. in the South and 3.4% p.a.
in the North in the 10 years to December 2015.
Figure 18: Perth prime grade net rents
Average rents in the East precinct are forecast to remain
steady in much of 2016 and 2017. Over the five years to
2020, prime rents are forecast to grow by only 1.6% p.a. in
the Perth East market.
Outlook – Fundamentals
Looking ahead, housing construction is expected to be one
positive driver of activity in Perth. Low interest rates, strong
growth in household net wealth and more stable consumer
confidence are also expected to stimulate a recovery in retail
spending growth in the medium term and flow on to demand
from traditional industrial occupiers.
Leasing enquiry for prime space remains steady, though
occupiers are taking extended periods to make relocation
decisions. Drawn out negotiating periods are expected to
continue as occupiers adopt a “wait-and-see” approach given
the uncertainty in the economic environment. Encouragingly,
demand from new sources such as the pharmaceuticals and
medical equipment groups have emerged. Furthermore,
demand for hardstand space may increase as mining
construction projects complete and machinery returns
to Perth from construction sites in the North of Western
Australia. Other sources of new activity are groups looking
to consolidate multiple operations and 3PL’s that have been
awarded new contracts.
* As at Q4/2015
Source: JLL Research
Manufacturing
Retail Trade
Transport and Storage
Wholesale Trade
Construction
Mining
Other
14%
21%
38%
11%
3%
5%
9%
Source: JLL Research
* As at Q4/2015
50
75
100
125
150
Prime grade existing
net face rents $/sqm p.a.
Dec-05
Dec-10
Dec-14
Dec-08
Dec-12
Dec-16
Dec-19
Dec-07
Dec-11
Dec-15
Dec-18
Dec-09
Dec-13
Dec-17
Dec-20
East
North
South
Forecast
Dec-06
.91
A-REIT ANNUAL REPORT
2015/2016


