INDEPENDENT MARKET STUDY
M E L B O U R N E
Melbourne industrial market
Large corporations have always viewed Melbourne as a
strategic location for national or regional distribution centres.
Overall real estate costs are generally lower in Melbourne
than in other states due to its lower relative land costs, while
distance to the shipping port, as well as links to road and rail
to interstate and national networks make Melbourne an ideal
location for distribution centres.
The Melbourne industrial market also benefits from the Port
of Melbourne being the busiest containerised, automotive
and general cargo shipping port in Australia with the highest
TEU volume per year.
Supply
Approximately 451,300 sqm of new supply was completed
in Melbourne in 2015, only slightly below the 10-year annual
average. Approximately 45% of total new supply was in the
West precinct, followed by the North at 32%, and the South
East at 21%. Overall, more than 82% of new supply in 2015
had a known pre-commitment.
The forward pipeline indicates that 207,200 sqm of new
supply is under construction and expected to be delivered
to the market in 2016, and another 240,500 sqm is at the
planning stages (Figure 7). Currently, more than 95% of the
space under construction in Melbourne has a known tenant
commitment.
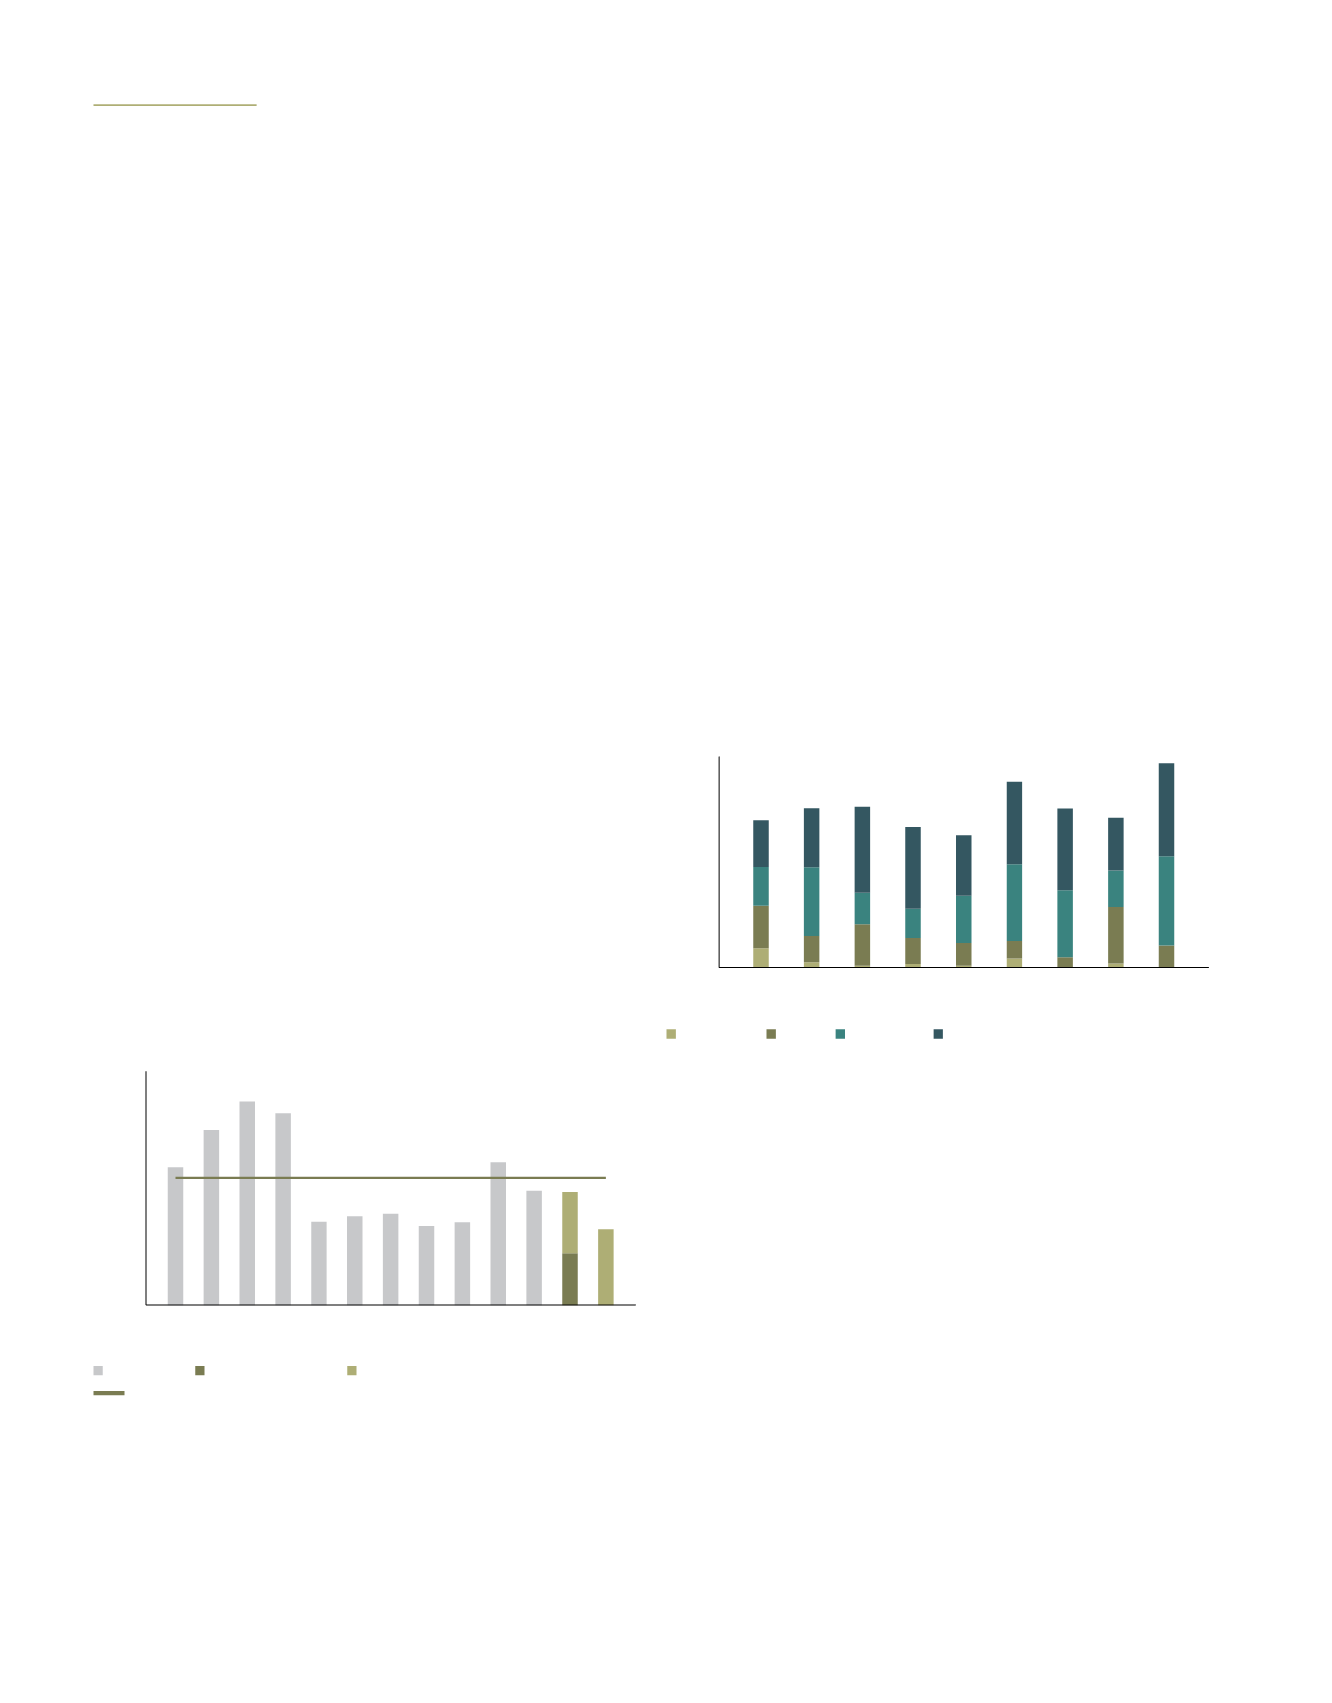
Figure 7: Melbourne industrial supply pipeline
The average development size was 14,900 sqm in 2014 and
14,600 sqm in 2015. However, based on the current supply
pipeline the average scale of developments across Melbourne
will increase to 19,500 sqm in 2016 due to a number of very
large, purpose-built facilities that were committed in 2015.
Demand
Melbourne continues to have one of the most stable
environments for industrial occupier take-up. Occupier gross
take-up in 2015 reached 694,900 sqm, the highest annual
figure recorded since 2006 and 20% ahead of the 10 year
annual average of 577,000 sqm (Figure 8). Prelease and
design and construct activity continues to be a driving factor
with 87% of gross take-up in 2015 negotiated in the new
build market, emphasising the preference of tenants to be
located in core markets and in modern space.
Figure 8: Melbourne industrial occupier gross take-up by
precinct
The West precinct of Melbourne has captured 45% of
major occupier take-up since 2007, owing to its cheaper
development land base and more readily available
development land supply. Over the same period 34% of
take-up was in the South East precinct.
Take-up in the North declined somewhat during 2011-2013
due to an inactive development market. However, recent
activity around Tullamarine Airport has lifted occupier activity
in this precinct. Overall, the North precinct has accounted for
18% of gross occupier take-up since 2007. Meanwhile, the
City Fringe precinct accounted for only 3% of major occupier
take-up over the same period.
The transport and storage sector has accounted for 36%
of occupier take-up in Melbourne between 2013 and 2015,
followed by the manufacturing industry (26%), retail trade
(21%) and wholesale trade with 8% (Figure 9).
* As at Q4/2015
Source: JLL Research
0
200
500
800
300
600
900
SQM (‘000s)
100
400
700
Completed Under Construction Plans approved/submitted
10 year annual
2008
2005
2006
2010
2012
2009
2007
2011
2013
2015
2016*
2017*
2014
10 year annual average
* As at Q4/2015
Source: JLL Research
600
700
SQM (‘000s)
500
400
300
200
0
100
2008
2010
2012
2009
2007
2011
2013
2015*
2014
City Fringe North South East
West
.86
A-REIT ANNUAL REPORT
2015/2016


