INDEPENDENT MARKET STUDY
P E R T H
Perth industrial market
Perth has undergone a transformation in the last decade as
a result of the mining investment boom. Population growth
has been among the strongest in the country, while wages
and household asset values have also grown strongly during
this time.
The impact on the Perth industrial sector has been profound.
Major retail brands, third-party logistics providers and other
corporates have grown strongly in the Perth market during this
time. Despite the mining investment booms, take-up in the
direct market by mining industry occupiers in Perth was only
7% of the total between 2007 and 2015 (> 3,000 sqm spaces).
The Perth market is not heavily institutionalised and the land
market is tightly held by private developers. As a result,
speculative construction is scarce and market rents have
grown strongly in the last decade.
Supply
Approximately 71,700 sqm of supply was completed in
2015, well below the 10 year annual average of 149,000
sqm. However, there is a stronger pipeline of industrial
supply expected in 2016. There is currently 181,800 sqm
under construction and due to complete in 2016 (Figure 15).
Approximately 97% of these projects are pre-committed
and are led by major retail and wholesale groups moving
to purpose-built facilities, including ALDI, CEVA Logistics,
Mainfreight, Kmart and Hitachi. As a result, the average
development size in 2016 is expected to increase to 22,700
sqm, more than double the five year average of 9,000 sqm.
Figure 15: Perth industrial supply pipeline
Demand
The Perth market has undergone an above average demand
cycle since around 2010 as a result of commitments to new
facilities as businesses have grown their operations and
required new warehouse and distribution facilities. After a
subdued tenant environment in 2014, occupier gross take-
up reached 262,700 sqm in 2015 (> 3,000 sqm deals), which
is 29% above the 10 year average of 203,000 sqm p.a.
(Figure 16).
Vacancy has reportedly increased in the past year or two due
to some engineering and mining services related businesses
downsizing and rising backfill opportunities. Active tenants
in Perth now have more options than in previous years, while
some tenants that had previously located in the East are now
assessing cheaper land/rent options in the South in an effort
to reduce costs.
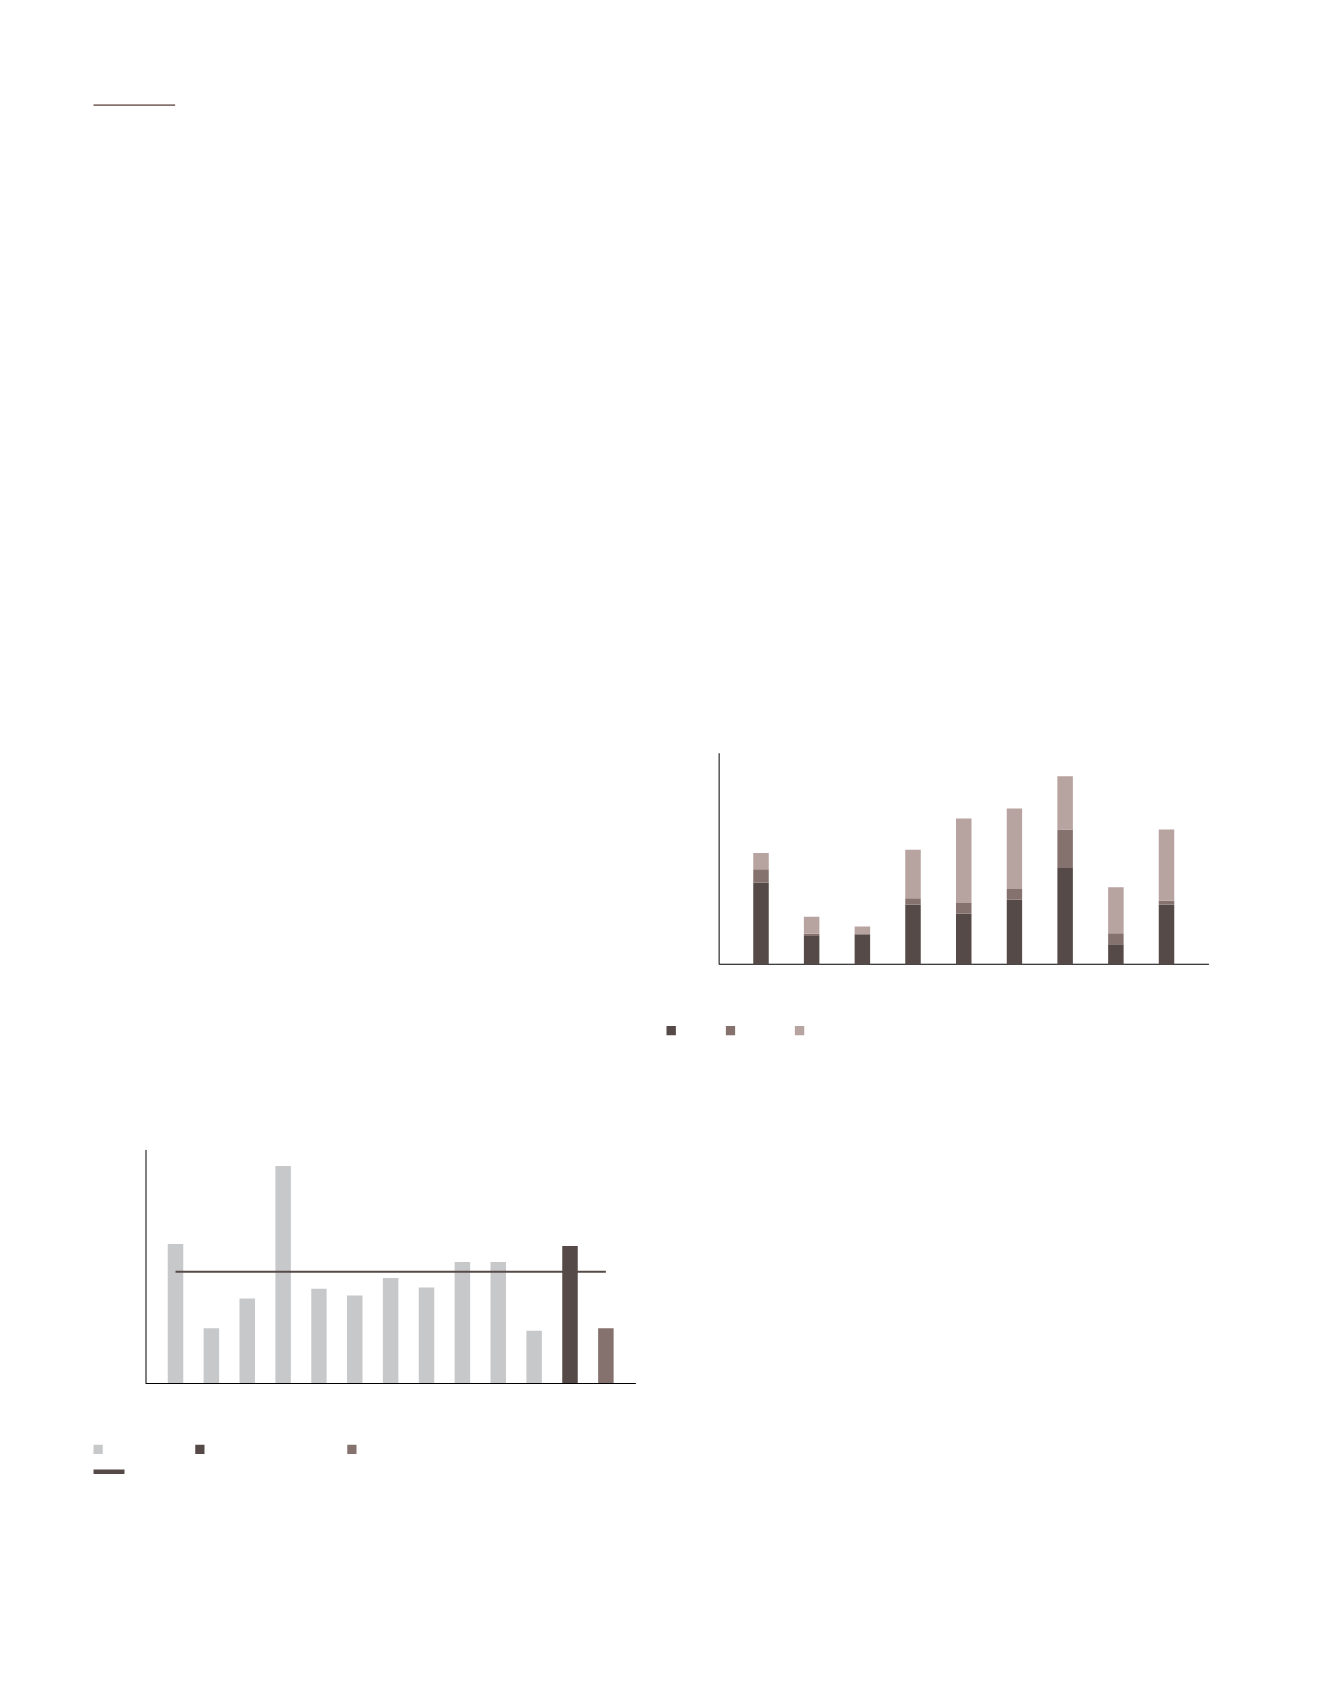
Figure 16: Perth industrial occupier gross take-up by precinct
The East precinct has captured 49% of major occupier take-
up in Perth since 2007, having been one of the more active
land development markets since 2006 and its strategic
proximity to the Airport and access to the Port and Perth
CBD. Less development sites in the East going forward
should be positive for owners of modern existing stock.
Take-up in the South has improved since 2010 due to new
land releases. As a result, the South precinct has accounted
for 42% of gross take-up since 2007.
* As at Q4/2015
Source: JLL Research
350
400
SQM (‘000s)
300
250
200
150
0
100
50
2008
2010
2012
2009
2007
2011
2013
2015*
2014
East
North South
* As at Q4/2015
Source: JLL Research
0
50
200
100
250
300
SQM (‘000s)
150
Completed Under Construction Plans approved/submitted
10 year annual
2008
2005
2006
2010
2012
2009
2007
2011
2013
2015
2016*
2017*
2014
10 year annual average
.90
A-REIT ANNUAL REPORT
2015/2016


