INDEPENDENT MARKET STUDY
B R I S B A N E
Brisbane industrial market
Brisbane has undergone a steady occupier recovery in recent
years led by large corporate occupiers upgrading facilities,
consolidating operations or creating a major Brisbane
distribution centre for the first time. The Brisbane market has
had favourable underlying dynamics due to the very strong
population growth in Queensland in the last two decades
and the strong economic expansion in regional Queensland
related to resource investments. As a result, the South East
Queensland resident population base has grown considerably,
creating a strong case for industrial occupiers to grow.
Supply
Approximately 354,400 sqm of new supply was completed
in Brisbane in 2015, in line with the 10 year annual average
of 357,000 sqm (> 3,000 sqm projects). Higher levels of
speculative development have occurred recently, with more
than 33% of supply completing speculatively in 2015. Large
corporates, particularly in logistics and manufacturing,
continue to drive pre lease and design and construct projects
due to their somewhat specialised space requirements.
The forward pipeline indicates that supply will be more
subdued in 2016 with only 163,100 sqm under construction
and a further 52,700 sqm at the planning stages (Figure
11). Almost 27% of supply currently under construction
is speculative. Over the past five years, the average
development size in Brisbane has ranged between 10,000
sqm and 12,500 sqm. Based on the current supply pipeline,
this trend is expected to continue in 2016 with the average
development size sitting at 11,400 sqm.
Figure 11: Brisbane industrial supply pipeline
Demand
Gross occupier take-up in Brisbane was 453,700 sqm in 2015
(> 3,000 sqm deals), slightly above the 10 year average of
446,000 sqm p.a. (Figure 12). Occupier activity in 2015 has
been concentrated in the new build market with more than
54% of take-up by area reflecting a pre-lease or a design and
construct deal.
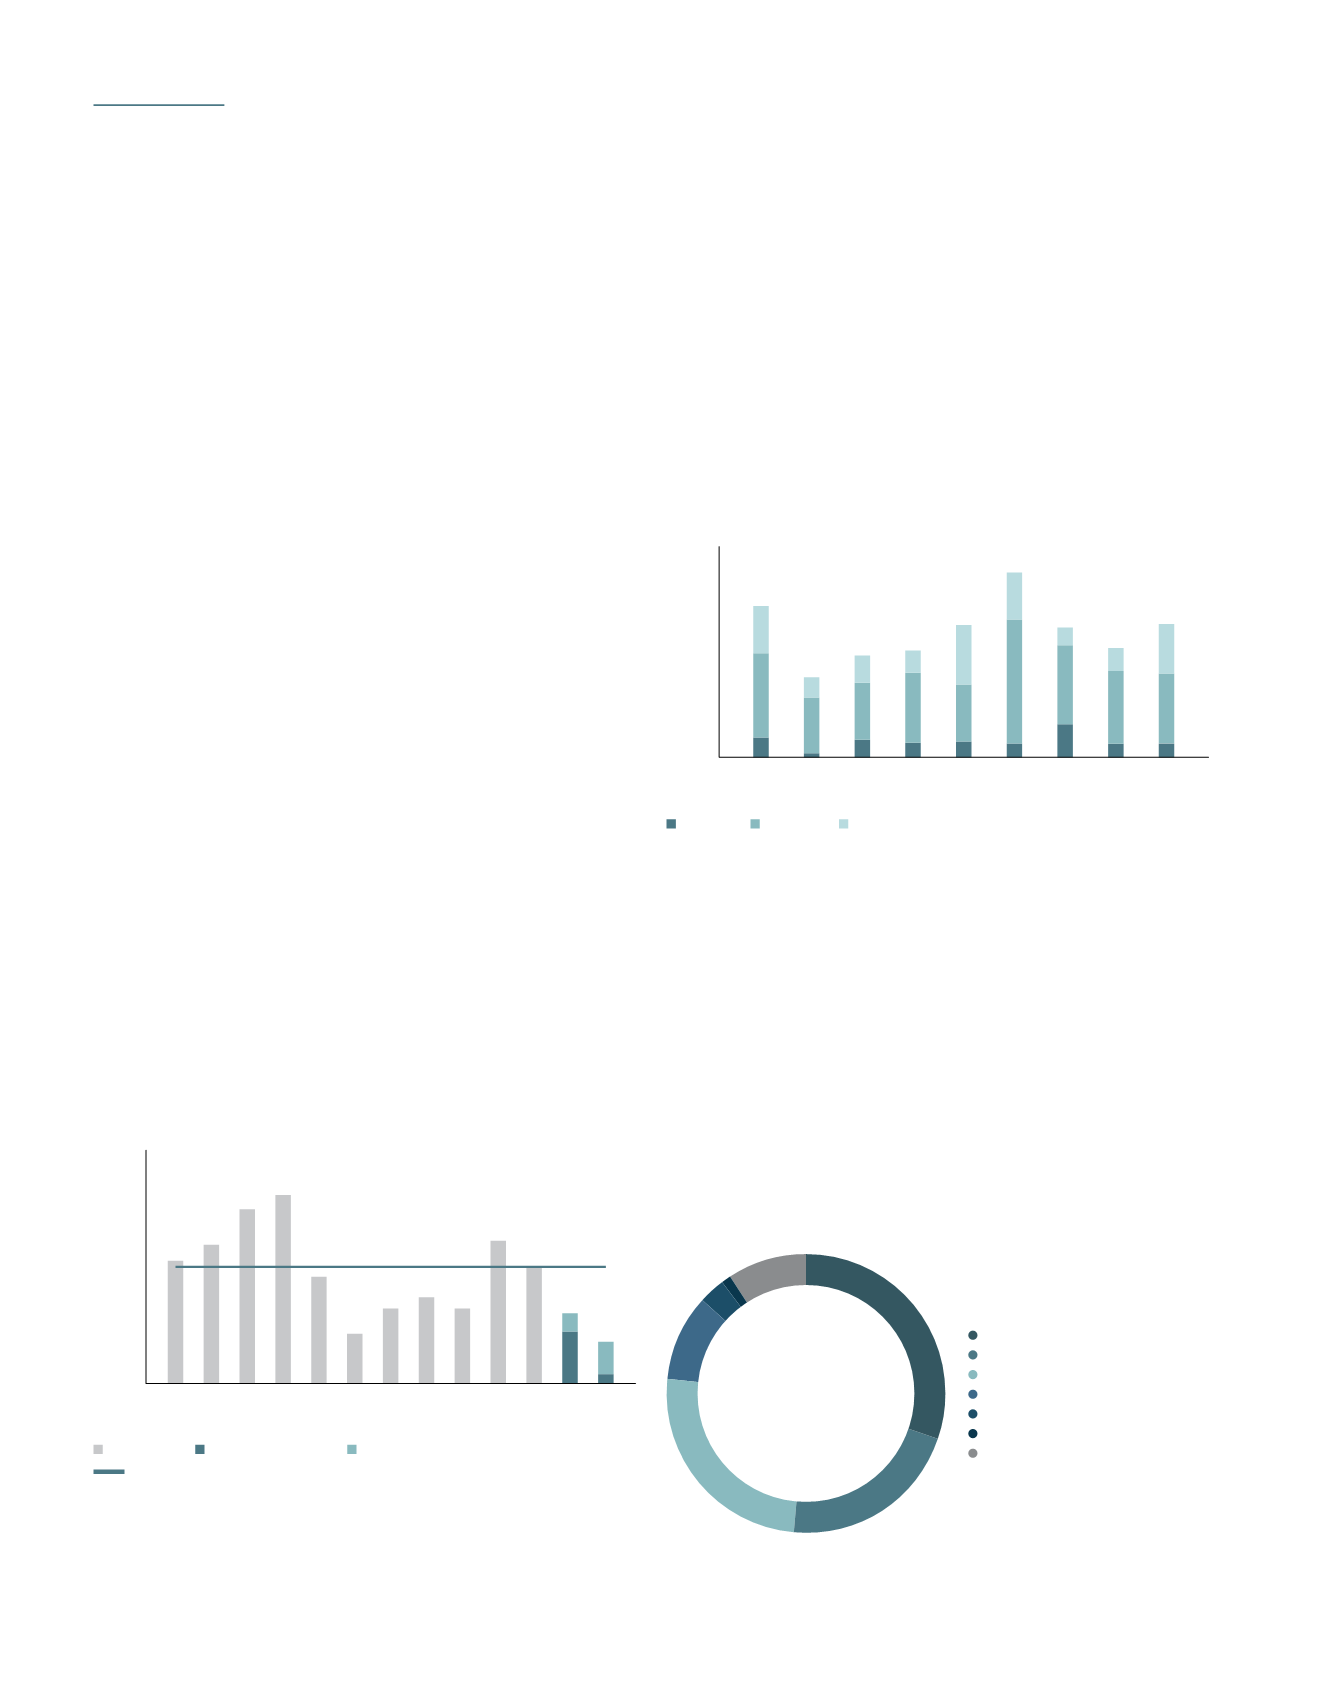
Figure 12: Brisbane industrial occupier gross take-up
by precinct
The Southern precinct has captured the largest proportion
(59%) of major occupier take-up in Brisbane since 2007, owing
to its larger geographical coverage, more development land
and strategic exposure to the Logan Motorway. The Trade
Coast precinct followed, with 28% of take-up over the same
period. Land supply has been constrained in the Trade Coast,
particularly freehold land, resulting in lower construction activity
in this period. Meanwhile, the Northern precinct has only
accounted for 14% of major gross occupier take-up since 2007.
Figure 13: Brisbane gross take-up by industry sector:
2013 to 2015
* As at Q4/2015
Source: JLL Research
0
200
500
300
600
700
SQM (‘000s)
100
400
Completed Under Construction Plans approved/submitted
10 year annual
2008
2005
2006
2010
2012
2009
2007
2011
2013
2015
2016*
2017*
2014
10 year annual average
* As at Q4/2015
Source: JLL Research
600
700
SQM (‘000s)
500
400
300
200
0
100
2008
2010
2012
2009
2007
2011
2013
2015*
2014
Northen Southern Trade Coast
* As at Q4/2015
Source: JLL Research
Manufacturing
Retail Trade
Transport and Storage
Wholesale Trade
Construction
Mining
Other
30%
21%
25%
10%
3%
1%
9%
.88
A-REIT ANNUAL REPORT
2015/2016


